March 22, 2020Two Views of the COVID-19 CrisisI have posted an interactive chart of USA COVID-19 cases. 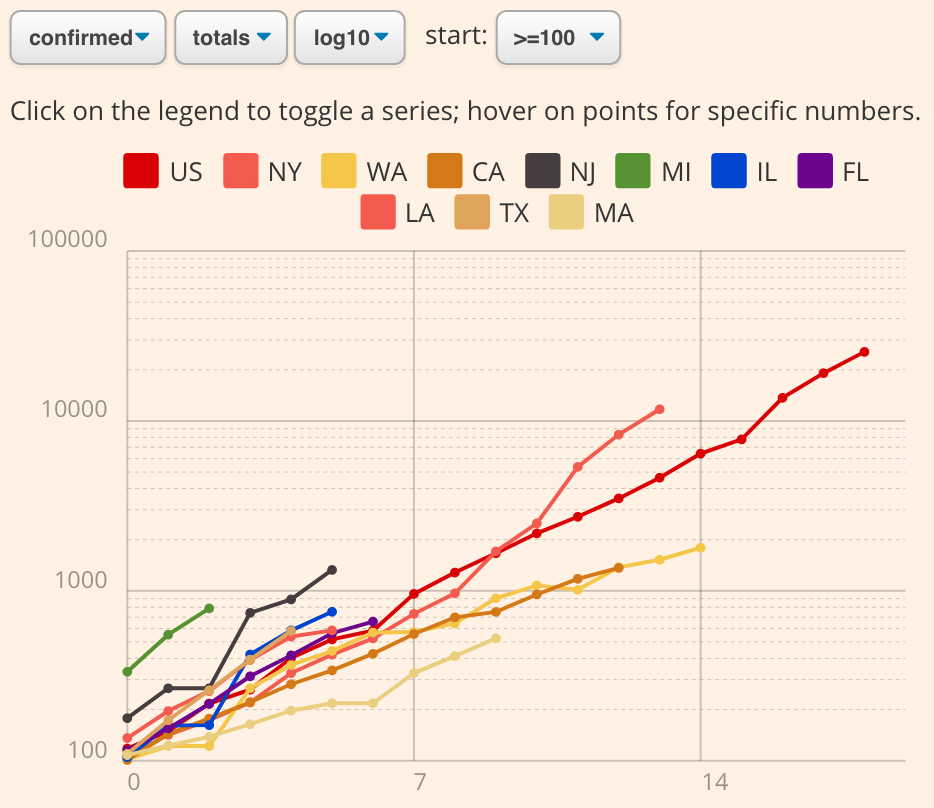 This chart lets you see coronavirus data from two different points of view: the policymaker's view, and the doctor's view. For policymakers, the chart lets you see USA data in the same way the Financial Times COVID-19 plot by John Murdoch compares policies internationally. Select the logarithmic totals with a '>=100' starting threshold, so that "day zero" is the first day there are 100 cases in a state. Over time, if different states' policies have different effects on the growth of the virus, the exponents, and therefore the slopes, will reveal the differences. The other point-of-view is the doctors-eye view. Doctors must deal with the patients who walk into the ER and who who lie sick in ICU beds. To anticipate these numbers, switch to the 'delta linear' view in the current month. The spikes show why the panic is justified, and why minor policy changes have massive ramifications. 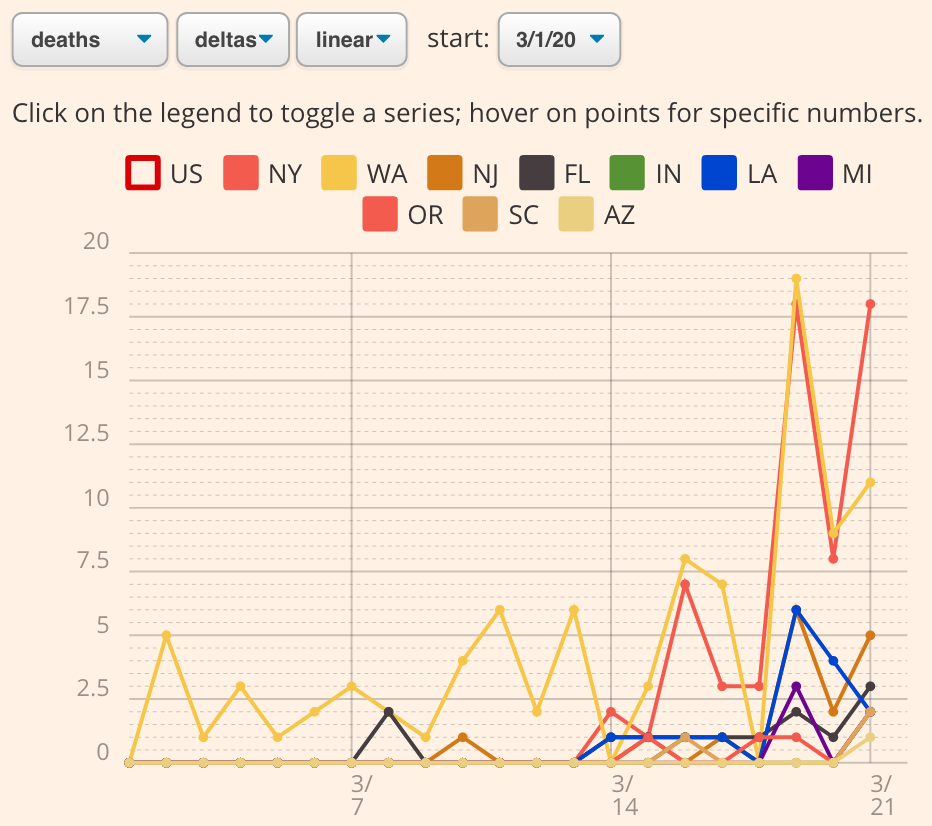 The takeaway? The chart re-emphasizes the point that this is not a game. There is a huge gap between the "policymaker's" view and the "doctor's" reality on the ground. Slight changes from a policymaker's point of view have massive ramifications for doctors. After our leaders negotiate about a "gradual" shutdown of car factories, Michigan illnesses explode. After beaches stay open for one last lucrative spring break party, Florida cases skyrocket. And what begins as a local outrage will become a healthcare shortage, then a nationwide menace. A single idiotic master of the universe could trigger an outbreak that will use up the ventilators that would have saved your grandfather. In our 50 states we are all linked. Despite dramatically different local policies, it is likely that our rate of infection growth will be largely the same across the country. In coming days, this chart will tell the story of our national interconnectedness. Please. We need to take the crisis more seriously than we are. Our corporate, city, state, and federal leaders are not doing enough. "Social distancing" of the coastal elite needs to give way to a much more universal regime of physical isolation, enforced shutdowns, shifting of priorities, deferral of debts, and testing, testing, testing, nationwide. The graph automatically updates every day based on current data. Please share. And please isolate. I made the chart to help Heidi (who is a surgeon at MGH) see summaries of some USA statistics that are not being plotted in the media. The code is open-source at github.com/davidbau/covid-19-chart. It is just a bit of HTML and JS, and should be easy to extend to show more information. Pull-requests are welcome. Comments
Wow, it's crazy to see how differently people view things when they're walking in different shoes. Posted by: Key Ellis at May 18, 2020 05:14 PMWow, we don't have enough doctors or human resources in hospitals for policymakers to be so reckless. Posted by: Jordyn Smith at May 18, 2020 05:19 PMDigital realty agents is the best of the best when it comes to lead generation businesses in Dallas and Dallas social media marketing - check us out! Posted by: Jeff Haynes at May 18, 2020 05:31 PMPost a comment
|
| Copyright 2020 © David Bau. All Rights Reserved. |